Project Stormfront – The Movement

So far, what I have discovered is there seems to be an association between temperature and barometric pressure (specifically the 1016 and 1018 mb) that has a huge effect on the production of storms and the direction it gets it’s energy from. I know that storms feed from low temperatures to high temperatures. I know that there is some sort of tie with the 1016 and 1018 mb isobars when it comes to severe weather. I know also that the slower the temperature change the farther the temperatures are and the less energy these storms have. This was found just by observing simple satellite loops at the College of DuPage weather site.

Next is the movement. The movement of the storms and where they go is based on the winds in the 500mb (18289 feet) level of the atmosphere. If one wants to know which way a storm is going to go, just jump up to 18,289 feet and check it out. This was already known and discovered, but it can help tremendously in tracking a storm’s path.

500mb or 18,289 feet overlay. Click on image for a larger view.

If one was storm spotting or chasing this would prove to be vital in order to position themselves in a safe area for observation. One would have to have internet access to get to the loops and overlays for retrieving this sort of information. You could also use your radar application as well. This would be helpful when forecasting and determining the location you should be at. This an the 1016 and 1018mb and temperatures and other resources that will be discussed later, could get you in a good location.
Pressure And Temperature Relationship

I spent a good amount of time tonight looking at the College of DuPage’s live satellite data and I noticed that the 1016 and 1018 millibar isobars seem to enclose the storms occurring in central Missouri. I was sure that something would have occurred in our area since my weather station was reading 1018mb and the skies were filled with cotton balls. It obviously did not occur. the pressure dropped out past 1016 and as it did the line moved more to the west and produced storms there. What I noticed was the fact that the severe part of the storm would be right on top of and follow the 1018 line. I also noticed that storms would appear along that 1018 millibar isobar line. I would not be surprised if those storms that were not around the indicated 1018 millibar line also had a pressure of 1018 millibars as well, at least where the most activity was.

In addition to the pressure, when the storms died out the temperature divisions were spread out and the storms could not sustain themselves and in turn died out quickly. It is also noticed that as the sun goes down the temperature drops and the temperature divisions spread out causing the storms to dissipate and die out.

Frame of a GOES Satellite taken from College of DuPage. Notice the storms along the 1018 line that was circled.. I also circled the 1016 line as well.

I am pretty stoked at this discovery and I am anxious to get the Arduino sensor put together and start taking some measurements myself of the temperature, dew point and barometric pressure once every 30 – 60 seconds over a 24 hour period during a day of sever weather. I still have to purchase the equipment and the sensors and engineer and fabricate the device and make sure it is weather proof, yet still have the ability to take accurate readings.

In summery I truly believe that both the temperature and the barometric pressure have a huge effect on the production, sustainment and even direction of the severe thunderstorm, or any thunderstorm for that matter. Having this understanding when out storm spotting or chasing can allow a track and/or path of the severe thunderstorm and where one needs to go to stay a safe distance. I don’t have any doubt that this may have already been discovered, but as a layman and weather enthusiast with no college background on the topic. I can put this in terms that the common person can understand.

Possible 1016 Millibar Pressure Associated With Severe Weather

Not sure if there is any sort of pattern to this or not, but while looking at College of DuPage again I noticed a pattern here. The storms seem to be aligned with the 1016 millibar barometric pressure line. I have circled the areas in the below image that line up with 1016 millibars. It may not be anything, but it is in fact an interesting discovery to watch over a period of time. Will have to keep an eye on this to see if it continues over a period of time. Since storms are related to low pressure this would make sense.

Operation Storm-Front Radar Finding

This may be already known, but I want to assume that nothing is known and I am going to start as if this was brand new research because you never know. Some may consider this as “reinventing the wheel”, but something may have been missed in previous research documents and data.

Examination of various radar loops using the College of DuPage weather site, I started with the basic radar loop and then enabled the surface temperature layer. After examination of various storms throughout the United States, it was discovered that storms move in the direction of higher surface temperatures. I have added the radar loop below of June 27, 2019 to June 28, 2019.

Examination of most of the Nation it was found that some of the smaller storms were following the contour line of temperatures along the state of Kansas. It was also noted that the contour lines for those areas were much farther apart than the areas where the storms were tracking from cold to hot temperatures. Those storms or clouds that were following the contour lines of the temperatures had less potential energy than those storms that were crossing temperature contour lines that were much closer together. See radar loop below also taken from June 27-28, 2019.

It is safe to say from this discovery four things:
1. Storms track from cold to hot temperatures.
2. Storms tracking across close surface temperature contour lines are stronger.
3. Storms will also follow with surface temperature contour lines when the lines are much more spread out.
4. Those storms that travel with temperature contour lines lack storm potential energy.

It is also interesting to note that strong storms that bump up against a more spread out temperature contour line it loses strength and stalls out in that area and feeds back into itself creating a clockwise rotation which represents a weather high for that area.

I will have to continue to observe these phenomena to see if it stays consistent to my discovery. I will also need to take a look at fall, winter and spring to see if there are any changes to the paths that these storms take and if there is any difference between cold weather storms and warm weather storms and also compare our storm intensities with the surface temperatures. Data gathering with a proprietary sensor device would probe valuable to this discovery .

Introduction To Operation Storm-Front

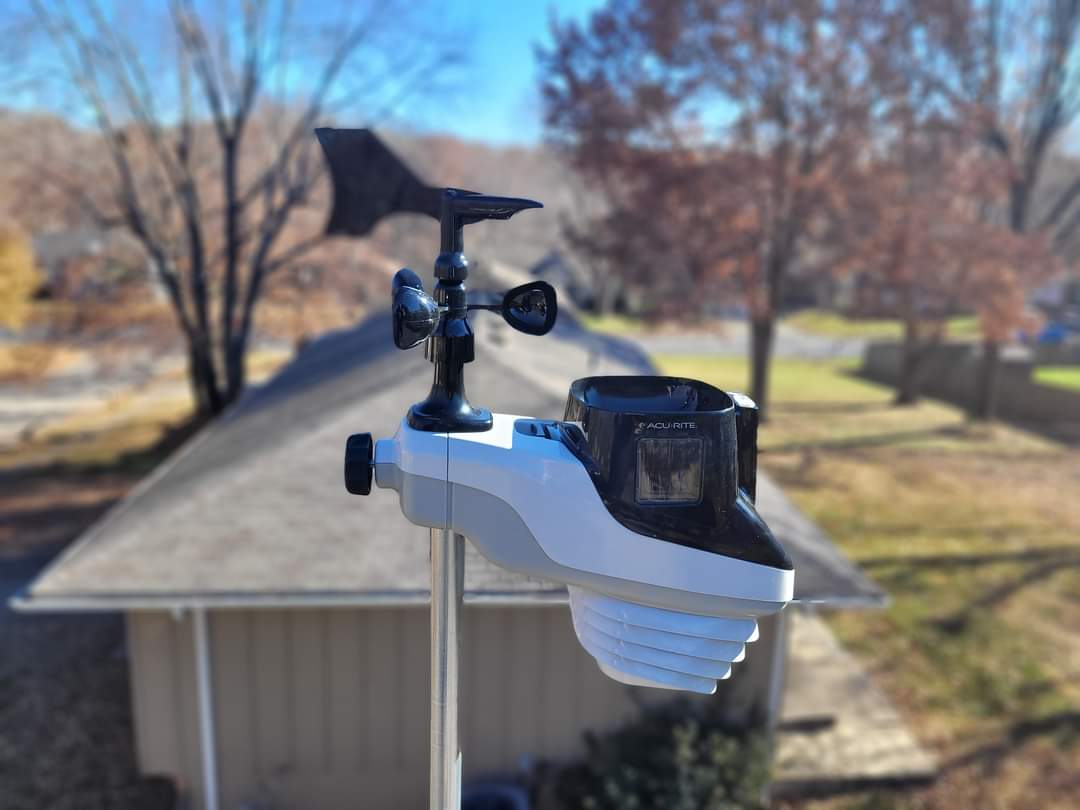
Operation Storm-front is a private research project with a goal to collect barometric pressure, temperature, dew point, and humidity data during a scheduled time of severe weather. This research project is being done in hopes to fully understand the concept behind a severe thunderstorm to help with prediction improvements.

The truth about tornadoes and advanced warnings, according to NOAA, is current warnings have only a 13 minute average lead time and a 70% false alarm rate. The tornado is hard to forecast and is still not understood and is still unpredictable.

North Blue Springs wall cloud
North Blue Springs wall cloud on 7 highway looking north.

For this research, I will be focusing on the thunderstorm and not the tornado for one reason, the tornado is the end result of a severe thunderstorm. The tornado is not the source, the thunderstorm is. If we can understand the thunderstorm, and examine the data of the severe thunderstorm, there is a good possibility we will find the missing link to tornado-genesis. If we find the missing link we will solve our problems with severe weather predictions and know what storms will be associated with tornado-genesis. It seems like people can get so focused on the result, they look past the fact that they need to switch to the source! Just like a cancer, the focus needs to be the source of the cancer not just the cancer itself! That source of the tornado can only be one thing, the severe thunderstorm.

Grain Valley storm front
Grain Valley storm front.

Operation Storm-Front research project will be conducted as time is available. Data collection from a proprietary designed device and examinations of radar displays and visual examinations of storms will be vital to this extensive research project. As data that is collected will be compared to baseline data from days that have no forecast of severe weather. The ending results and all data will be posted on this site for any and all to use for other research projects. Blog entries will be posted as data is collected and discoveries are found.

June 23, 2019 Non-Severe Thunderstorm Event

06:37am Observed temperature 65 degrees. Feels like 67 degrees. Humidity 99%/. Pressure 1010mb and falling. Winds at 1mph ESE gusting to 6. Dew point 64. Skies partly cloudy. Rain measurement 1.34″.
0703am lightning detected at 12 miles.
0724am Rain started. Steady moderate. Observed temperature 65 degrees. Humidity 99%. Pressure 1012mb and falling. Winds 2mph W gusting to 5. 7 lightning strikes recorded.
0730am Heavy rain.
0736am Moderate rain.
0745 Light steady rain.
0749am Rain measurement .22 inches.
0804am moderate rain.
0815am Heavy rain..
0821am 21 lightning strikes recorded. Observed temperature 65 degrees. Humidity 99%. Dew point 64. Winds 1mph SW gusting to 5. Pressure 1013mb and steady.
0823am Rain steady.
0827am Rain measurement .70 inches.
0846am Observed localized flooding of curbs and street intersections. Water flowing over roadways in areas with approximately 1/2 inch of water.
1115am approximate time rain stopped.
1230pm Rain measurement 1.37 inches.
12:30pm Light mist.
0136pm 22 lightning strikes recorded.
0136pm Observed temperature 68 degrees. Humidity 99%. Pressure 1009mb and falling. Dew point 67. Winds 0mph SW gusting to 5.

NO FURTHER ENTRIES FOR THIS EVENT.

Events of The June 22, 2019 storm.

10:06pm Rain Started
10:07pm Heavy rains.
10:10pm Moderate Rain.
10:16pm Light sprinkle.
10:16pm Recorded winds 3mph WNW gusting to 7.
10:17pm Rains light steady.
10:18pm Lightning count 329.
10:23pm Observed temp 70 degrees. Humidity 95%. Dew point 68. Winds 2mph SSW gusting to 11.
10:24pm Rains light and steady,
10:27pm Severe Thunderstorm alert.
10:28pm Heavy rains and wind.
10:30pm Lightning count 404.
10:31pm Observed temp 69. Humidity 97%. Dew point 68. Winds 6mph SSW gusting to 11.
10:35pm Rains light and steady.
10:35 Winds 5mph WNW gusting to 11.
10:49pm winds calm rain steady and light.
10:49pm Observed temp 68. Humidity 99%. Dew point 67. Winds 3mph gusting to 11. 503 lightning strikes. Pressure 1016mb and steady.
10:57pm Rain recorded .81 inches.
11:24pm Rain recorded .87 inches.
11:24pm 538 lightning strikes recorded.
11:43pm Power loss for Sherwood Village and 7 highway recorded.

NO FURTHER ENTRIES