This is just an addendum. I wrote a post on December 3rd research paper on the scientific link between sunlight or solar intensity and temperature. This research is proving out that the sun controls our environment, especially when it comes to sun intensity. The truth is that science reveals that based on the data collected over time.
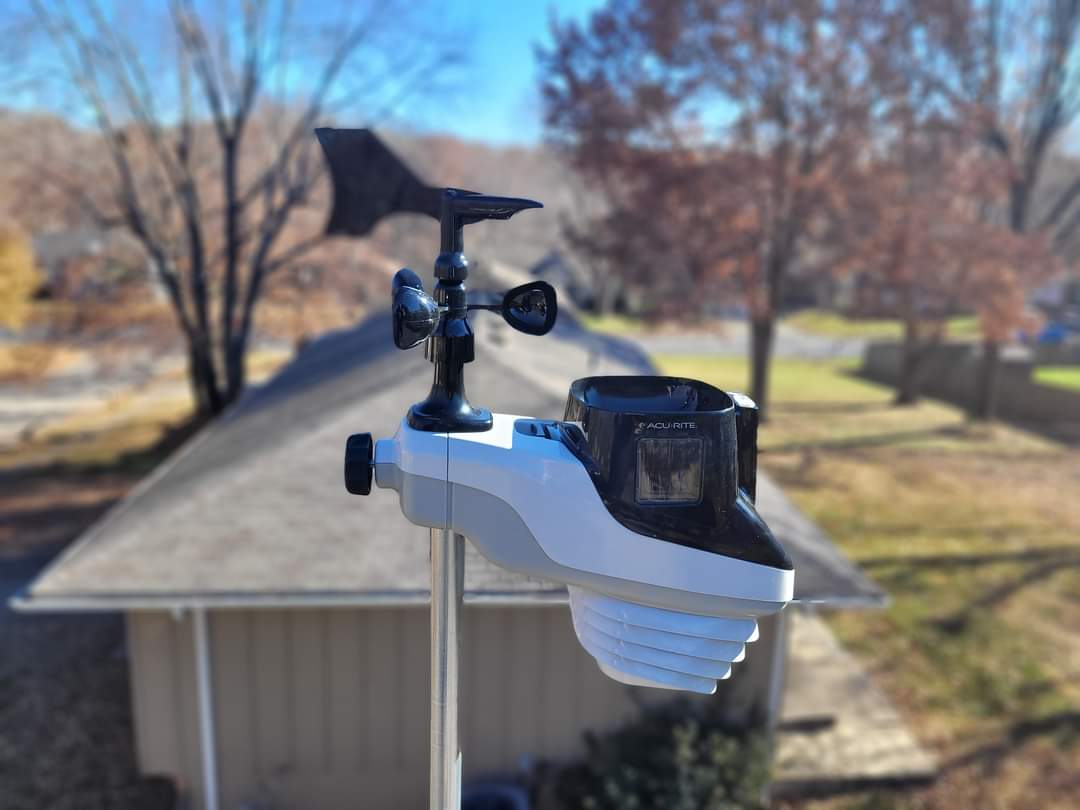
I continue to collect 30-day history from the AcuRite Atlas. The Solar intensity trends continue to follow the temperature trends according to the graphs below.


As we approach spring, the light intensity is trending back up. Solar intensity has gone from 47620 LUX on January 1, 2023, to 61120 LUX as of January 31, 2023. The length of daylight has slightly increased; we have gained about 48 minutes of daylight so far since January 1.
Conclusion
This research shows that light intensity determines the overall temperature. We may not see it match exactly with Solar Intensity, but over time, you see that the trends are the same. We should see an increase in our temperatures as we progress through 2023. We should begin to see the temperature trend shift flatten out as we progress.
As our solar cycle enters a Grand Solar Minimum, temperatures may continue to trend downhill or take longer to recover this year, making spring shorter during our transition. Only time will tell as I continue to collect the recorded data and light intensity from the Atlas. I will post an article explaining the Grand Solar Minimum and linking back to the scientific evidence that proves sunspots are linked to temperature and weather.
If you liked this post, please consider sharing it on your social media sites, or if you have your own blog, please consider linking back to my post. You can even provide some positive comments on my posts. This will get the word out with the truth. If you want to receive immediate updates to my posts via email, please subscribe. MP

